Recreational Weather Report for Mammoth Mountain & the Eastern Sierra
2-16-22 at 10:30 AM
Weather Forecast Overview: Here is what to expect over the next 10 days. A ridge of high pressure will be building back in the area into the upcoming weekend. The result will be warming temperatures, clear skies, and less wind starting on Thursday.
By late on Sunday into next Monday the next inside slider will be moving into the area bringing more snow showers. There will be several inches of fresh snow possible along with gusty winds and cooler high temperatures.
That next inside slider will take it’s time moving to the east so expect cooler conditions most of next week under a E to NE flow.
If you’re going to be out on the hill Thursday into Saturday you can expect clear skies with highs around the Main Lodge in the low 40s with night time and early morning lows in the mid 20s. Winds will be 5-15 MPH out of the N to NE with upper mountain winds in the 15 to 25 MPH range.
Lower Elevations: Mammoth Lakes highs will be in the mid to upper 40s with Crowley Lake in the low to mid 40s while Bishop and the Round Valley areas will be in the low to mid 60s with just light winds. The north to north east flow will prevent any big warm ups like we had last weekend.
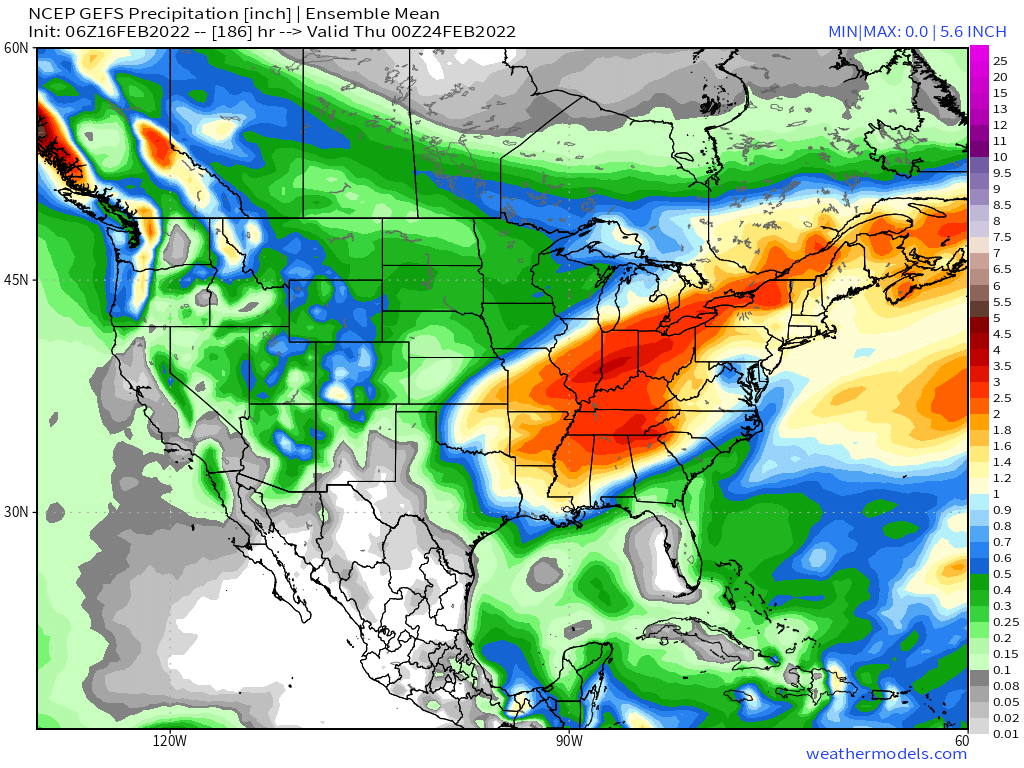
 Snowfall Outlook for next week: Here is the GEFS over the next 10 days, you can see the next system for Monday / Tuesday showing up with 2-4 inches of additional snowfall in this forecast.
Long Range Fantasy Outlook Charts for Snowfall into March
Taking a look at the rest of winter and the first 10 days of spring long-range models still show lots of hope for more snowfall. With that said at this point in time confidence is low in any outcome in the long-range outlook.
While the long-range forecasters were great during the Fall and into December they have been a bust the last few weeks showing wet cycles that have never materialized.
The good news in what we are seeing is these charts show some snowfall and not 45 more days of being shut out from precipitation.
Below the long-range GEFS model gets a bit wetter on each run for the month of March. Most of the precipitation this model is showing is way out past March 8th.
 Here is the EPS Ensemble Control model.
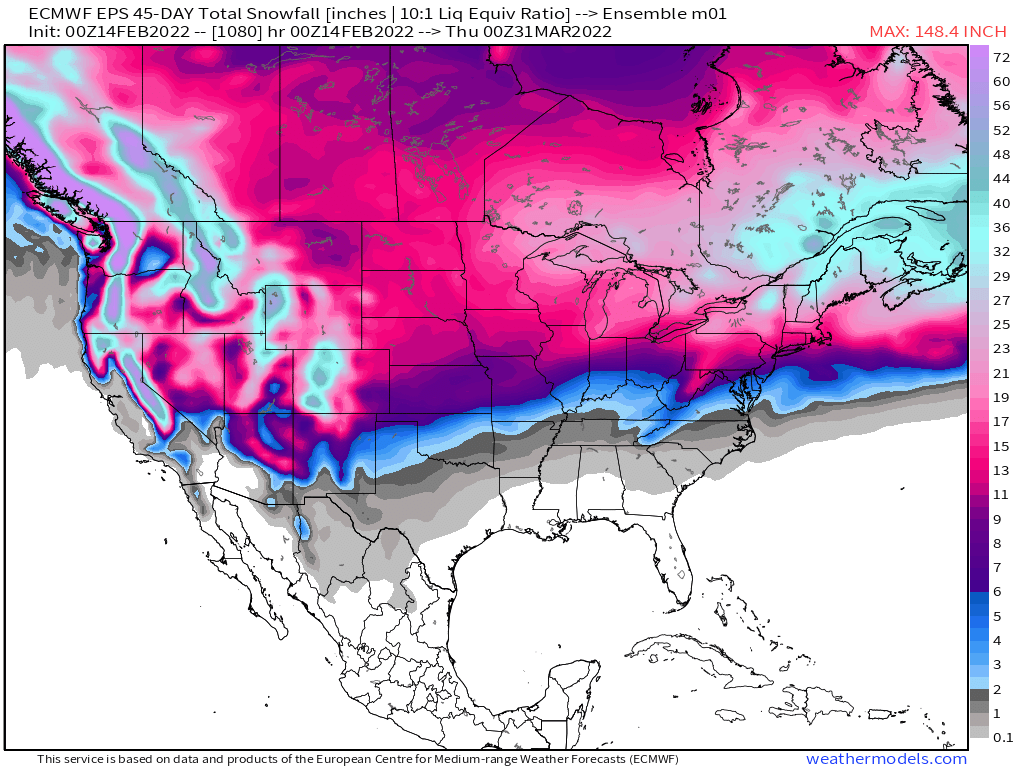
The EPS Mean – These charts represent the average data from 50 EPS models. What you see below would add up to 4-6 feet of snow over a 45 day period of time. Again these charts we are looking at are outlooks, not forecasts.
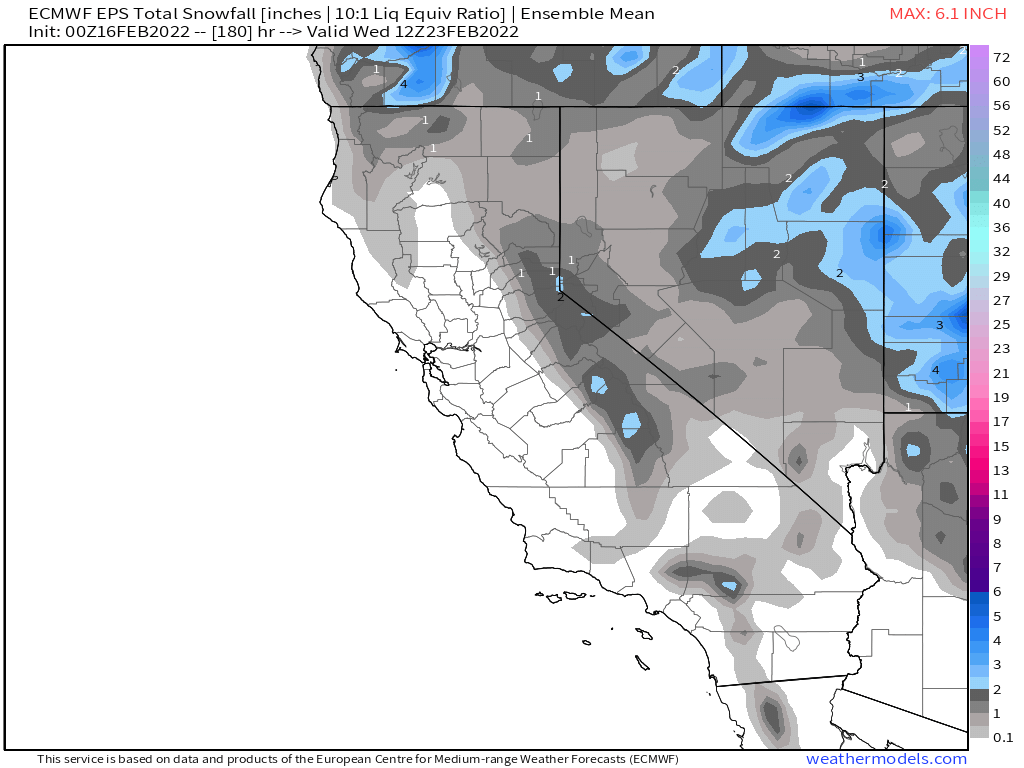
The EPS Mean into February 24th 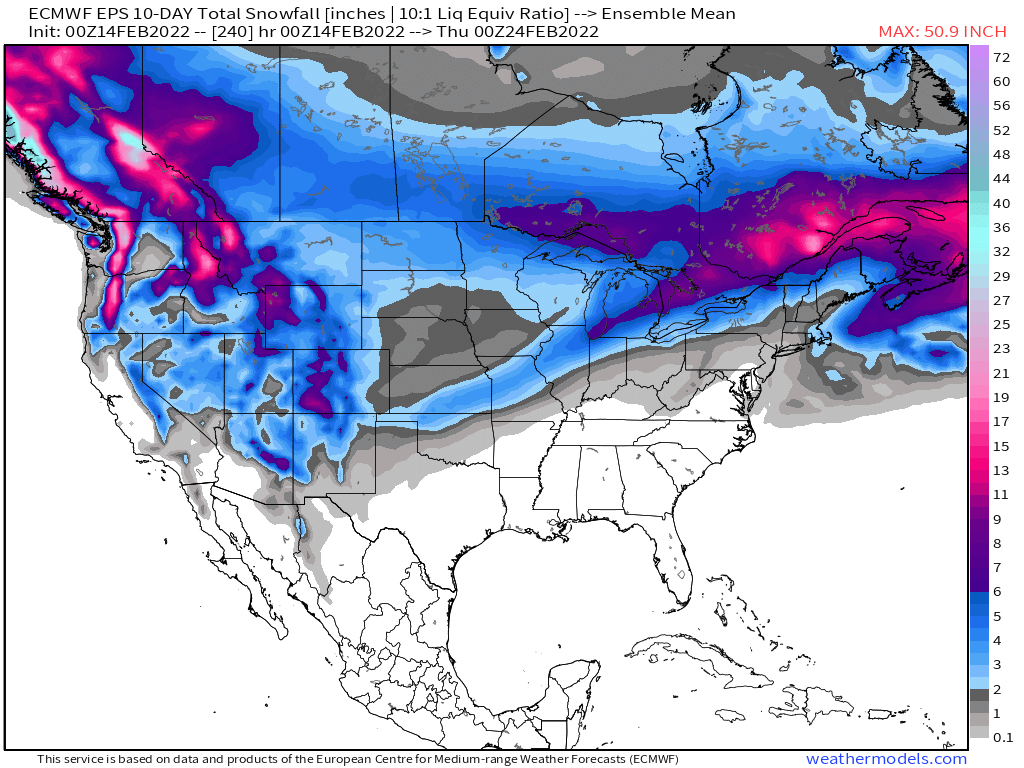
The EPS Mean into February 24th to March 6th – Days 10 – 20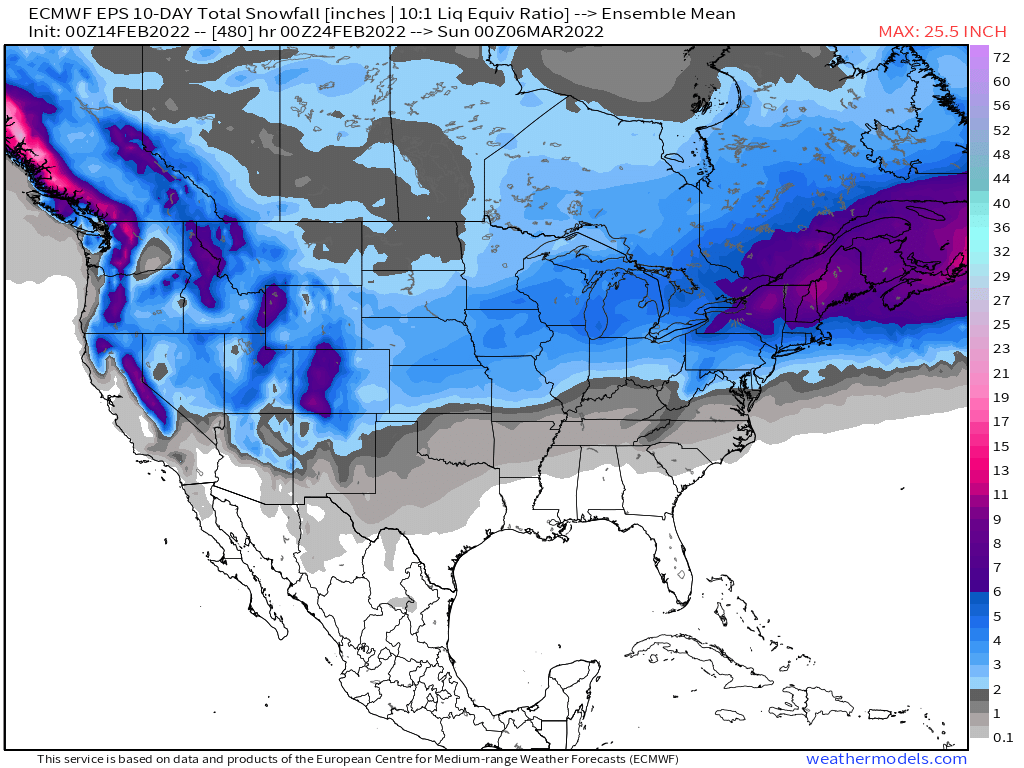
The EPS Mean day March 6th into March 16th – Days 20 – 30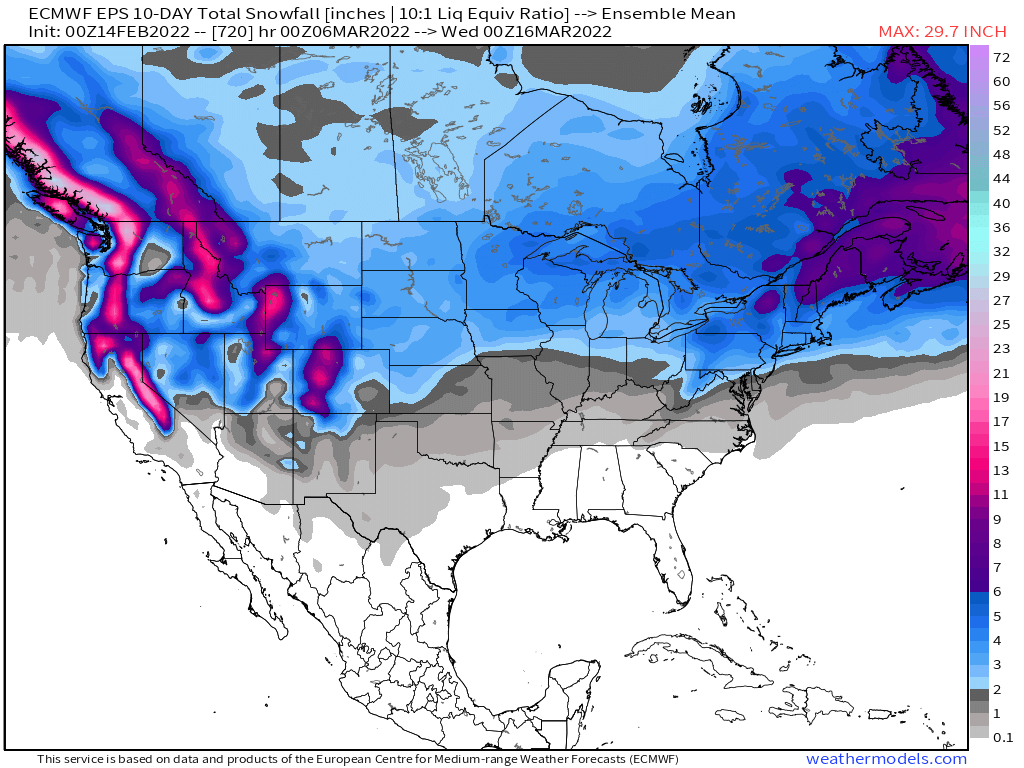
The EPS Mean March 16th into March 26th – Days 30 – 40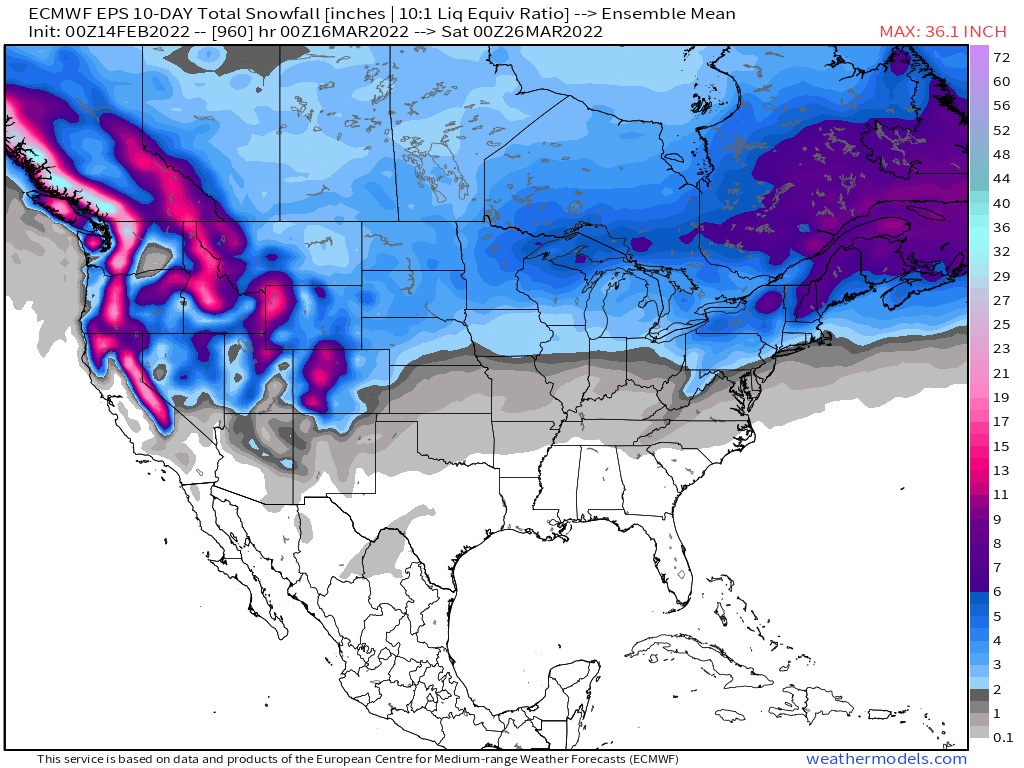
45-day Snowfall Chart